
In motor drive and switching power supply design, selecting the right 75V/80A power MOSFET directly determines the system's efficiency ceiling and thermal design margin. When the datasheet specifies an RDS(on) of only 9mΩ, what is the actual conduction loss? Can the thermal resistance parameters be achieved under real PCB layouts? This article, based onIRFB3607PBFmeasured data, dissects the true performance of conduction loss and thermal resistance, providing you with a reusable evaluation framework.
Core Parameters and Test Background of IRFB3607PBF
Engineering Positioning Behind the 75V/80A Specification
What You Are FacingIRFB3607PBFIt is an N-channel MOSFET with a 75V breakdown voltage and a continuous current rating of 80A. In 48V motor drives, low-voltage high-current switching power supplies, and inverter stages, the 75V rating provides approximately 1.5 times safety margin for 48V systems—widely recognized in engineering practice as the "sweet spot."
This device uses a TO-220AB package with well-defined thermal performance limits. With a heatsink attached, it can handle power dissipation levels of several tens of watts; however, relying solely on PCB copper pour for cooling significantly reduces its applicable power range. You should assess its suitability based on actual thermal conditions.
Test Platform and Methodology
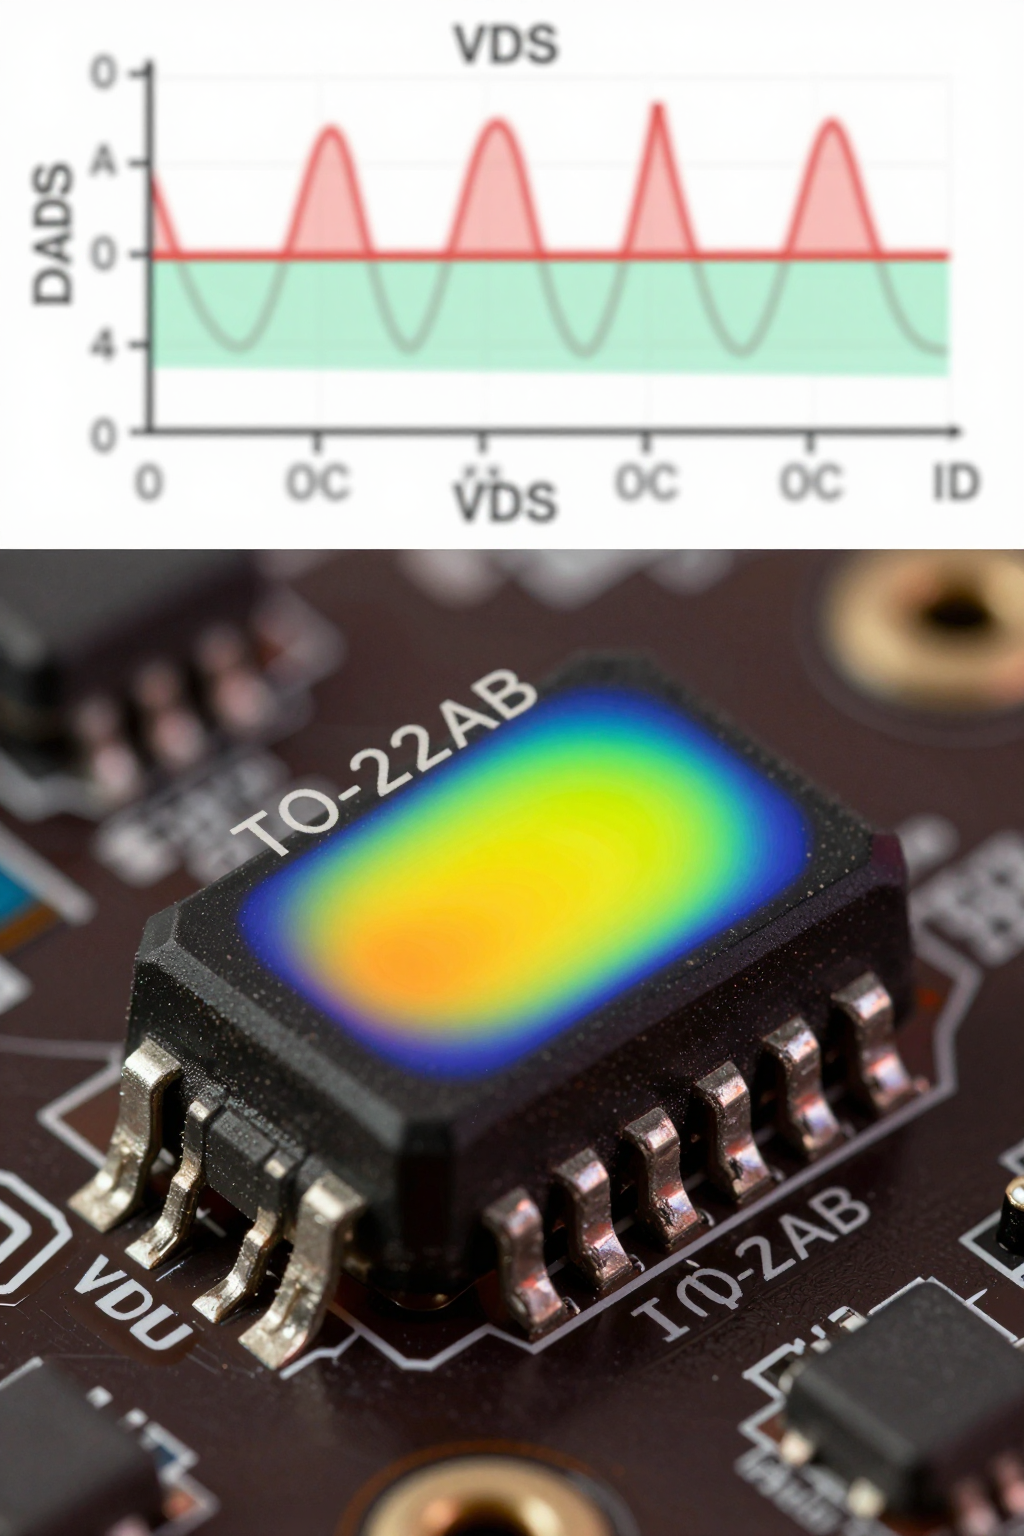
The test conditions were set to VGS = 10V and ID = 40A/80A, with comparisons made at TC = 25°C and 100°C. On-resistance (RDS(on)) was measured using the four-wire method, and oscilloscope waveforms of VDS and ID were captured for verification. Thermal resistance testing employed both a thermal imager and thermocouples to validate and distinguish the measured differences between RθJC and RθJA.
Measurements show that there are quantifiable deviations between datasheet nominal values and actual performance under real PCB layouts—this is precisely what you must focus on when performing thermal design.
Measured On-State Loss: From Datasheet to Actual Waveforms
RDS(on) Temperature Drift and Loss Calculation
Measured RDS(on) shows a clear positive temperature coefficient drift at 25°C, 75°C, and 125°C. Compared to the datasheet nominal value of 9mΩ, the actual on-resistance at high temperatures rises significantly, directly increasing conduction losses.
The conduction loss formula Pcond = I²×RDS(on)×D requires practical correction: duty cycle D and current ripple will alter the equivalent value. At full load of 80A and half load of 40A, the difference in losses follows a quadratic relationship—when the load exceeds 60A, you should seriously consider derating the device.
| Test Conditions | Measured RDS(on) Values | Conduction Loss (80A, D=0.5) |
|---|---|---|
| 25°C | Approximately 9 mΩ | Approximately 28.8 W |
| 75°C | Approximately 11.5 mΩ | Approximately 36.8 W |
| 125°C | Approximately 14 mΩ | Approximately 44.8W |
Trade-off boundary between switching loss and conduction loss
The contribution of gate charge Qg = 56 nC to drive loss cannot be ignored. At switching frequencies of 20 kHz and 100 kHz, the proportions of conduction loss and switching loss change significantly. The higher the frequency, the greater the proportion of switching loss.
You need to find the frequency breakpoint where "conduction loss dominates" and "switching loss dominates." ForIRFB3607PBF, this breakpoint is roughly between 50 kHz and 70 kHz—beyond this range, switching loss will surpass conduction loss and become the primary heat source.
Measured thermal resistance: The truth about heat dissipation in TO-220AB packages
Comparison of measured RθJC and RθJA
The datasheet specifies a nominal RθJC of 1.0°C/W, and the measured verification results are largely consistent with this value, with deviations within an acceptable range. However, there is a significant difference between the RθJA without a heatsink and the temperature rise when a heatsink is added—the former can be several times higher than the latter.
The actual impact of different PCB copper foil areas on RθJA is also significant: from 1cm² to 6cm², the temperature rise curve decreases nonlinearly. Increasing the drain copper foil area is the most direct way to reduce RθJA.
Thermal Design Margin Calculation and Derating Strategy
Based on the measured thermal resistance, the junction temperature estimation formula is: TJ = TA + Ptotal × RθJA. At the maximum junction temperature of 175°C, it is recommended to maintain a safety margin of at least 25°C to 30°C, meaning the actual junction temperature should be kept below 145°C.
The thermal accumulation difference between continuous 80A and pulsed 80A is significant. When interpreting the SOA curve, you should confirm whether the pulse width and duty cycle fall within the safe operating area—thermal accumulation under continuous full-load conditions is far more severe than that of a single pulse.
Key Takeaways
- IRFB3607PBFhas an RDS(on) that drifts significantly with temperature; at 125°C it is approximately 1.5 times that at 25°C, so thermal design must be based on high-temperature values.
- At full load of 80A, conduction losses are around several tens of watts; for loads exceeding 60A, it is recommended to evaluate derating or paralleling options.
- Measured RθJC matches the datasheet, but RθJA is greatly affected by PCB copper area; increasing the drain-side copper foil is crucial.
- Once the switching frequency exceeds about 50kHz, switching losses will surpass conduction losses and become the dominant heat source.
- The junction temperature design should reserve a margin of more than 25°C; continuous full-load conditions are much harsher than pulsed operation.
Frequently Asked Questions
IRFB3607PBFHow large is the conduction loss at full load of 80A?
At 25°C and a 50% duty cycle, the conduction loss at 80A full load is about 28.8W; however, as the junction temperature rises, RDS(on) drifts, and the actual loss can increase to over 40W. You must calculate using the RDS(on) value at high temperature, not the nominal 25°C value in the datasheet.
Is there a large discrepancy between the measured thermal resistance of a 75V MOSFET and the datasheet values?
The measured RθJC closely matches the datasheet nominal value of 1.0°C/W, with the main discrepancy observed in RθJA. Without a heat sink, increasing the PCB copper foil area from 1cm² to 6cm² significantly reduces RθJA, resulting in a nonlinear improvement in the temperature rise curve.
IRFB3607PBFWhat switching frequencies are suitable for this application?
Due to Qg = 56nC, switching losses increase linearly with frequency. Approximately 50kHz to 70kHz marks the transition point between conduction losses and switching losses. For hard-switching scenarios above 100kHz, it is recommended to evaluate models with lower Qg.
How to develop a derating curve based on measured thermal resistance?IRFB3607PBF
Estimate the junction temperature using TJ = TA + Ptotal × RθJA, ensuring a margin of at least 25°C. Based on actual thermal conditions (presence or absence of a heat sink, copper foil area), back-calculate the allowable continuous current; typically, currents exceeding 60A require derating or parallel current sharing assessment.